This tutorial will guide you through the process of trading strategy development. A trading strategy is a set of rules or guidelines that a trader follows to make trading decisions. A well-designed trading strategy can help to increase the chances of success and reduce the risks of losses. In this tutorial, we will cover the basics of trading strategy development, including the different types of strategies, risk management, backtesting, experiments and examples of various methods for defining entries and exits points . The main objective is to measure and evaluate our strategy performance by testing, tweaking parameters reevaluate and generate measurable results in order to get better understanding of our strategy and its components. We will use real historical data to simulate and replay markets at different state and changing environment then analyze the outcome to identify the best market for our strategy, and we will be doing all of that the S.M.A.R.T. way.
https://en.wikipedia.org/wiki/SMART_criteria
What You Will Learn by the End of This Guide:
- What is a trading strategy
- Risk/Money Management
- Profit targets
- Risk tolerance
- Defining trades entries/exits
- Technical analysis
- Technical Indicators
- Chart patterns
- Fundamental analysis
- News and/or Economic data
- Technical analysis
- Strategy Testing
- Back-testing
- Forward-testing
What is Trading Strategy
A trading strategy is a set of rules that guide a trader's actions in the financial markets. The goal of a trading strategy is to identify profitable opportunities and minimize overall risk. Predefined rules could protect trading capital by it's managers personality traits and psychological traps like trading based on emotions or biases. There are many types of trading strategies, each type uses different tools and techniques to identify potential trades. While technological advancement is making trading more accessible it also introduce new trading concepts and components. The strategic approach to each of the components is equally important. We need a strategy for position sizing, entry and exit points, last but not least strategic thinking about fees. The combination of those 3 components is the absolute minimum that allows a trader to begin with basic Risk Management experiments.
Risk and Money Management
Money management is an essential part of trading strategy development. It involves determining the appropriate risk tolerance and setting profit targets.
Profit Targets
Profit targets are the levels at which a trader will take profits on a trade. Profit targets should be set based on the trader's risk-reward ratio and trading objectives.
Risk Tolerance
Risk tolerance is the amount of risk that a trader is willing to take on each trade. Risk tolerance should be set based on the trader's trading style, financial goals, and risk appetite.
Defining Trade Entries and Exits
Traders need to define their entry and exit points to execute their trading strategies effectively.
Technical Analysis
Technical analysis can help traders to identify potential entry and exit points using chart patterns and technical indicators. Technical Indicators such as moving averages, relative strength index (RSI), and stochastic oscillator can help traders to identify potential entry and exit points.
Chart Patterns
Chart patterns such as head and shoulders, double top, and cup and handle can help traders to identify early signs of possible trend reversal or continuation.
Fundamental Analysis
Fundamental analysis the process of analyzing the underlying economic and financial factors that affect the price of assets. Such as important news and economic data.
News and/or Economic Data
Changes in central bank policies, economic data such as employment reports, GDP, and inflation can also have a significant impact on the price of assets. Traders can use fundamental analysis to identify potential entry and exit points based on changes in economic data. Many traders do the opposite they monitor news events not to trade, but to avoiding trading activity. Because those events make markets more volatile therefore unstable increasing the risks for sensitive strategies to the unpredictable levels
Strategy Testing
Strategy testing is the process of evaluating a trading strategy by back-testing and forward-testing.
Backtesting
Back-testing involves testing a trading strategy using historical data to evaluate its effectiveness. Back-testing can help traders to identify potential weaknesses in their trading strategy and to make necessary adjustments.
Forward testing
Forward-testing involves testing a trading strategy in real-time using simulated trades. Forward-testing can help traders to evaluate the effectiveness of their trading strategy in real-time.
Let's go ahead and outline the main building blocks for our strategy:
Define the strategy parameters: time frame, risk per trade, profit target, etc.
Technical analysis setup: indicators and criteria for entries and exits.
Fundamental analysis integration: which events to watch and how they affect trades.
Risk management rules: position sizing, stop-loss, take-profit, and maximum drawdown.
Order placement using OTA orders: how to set up the entry and exit orders.
Backtesting and optimization: testing the strategy on historical data.
Execution and monitoring: live trading and adjustments.
Detailed Step-by-Step Trading Strategy Outline
1. Define Strategy Parameters
- Time Frame: Specify trading charts (e.g., daily, 4-hour).
- Risk Per Trade: Define percentage of account equity (e.g., 1-2%).
- Profit Target: Set monthly/quarterly goals (e.g., 5% compounded).
- Additional Parameters: Maximum drawdown, minimum trades/month, risk-reward ratio.
2. Technical Analysis Setup
- Indicators: Choose tools (e.g., EMA, Bollinger Bands, RSI).
- Entry Criteria: Conditions for opening trades (e.g., trend confirmation, volatility contraction).
- Exit Criteria: Rules for closing trades (e.g., fixed take-profit, trailing stops).
3. Fundamental Analysis Integration
- Key Events: Monitor high-impact news (e.g., central bank decisions, CPI, NFP).
- Impact Rules: Avoid trading during news releases or adjust stop-loss/take-profit levels.
4. Risk Management Rules
- Position Sizing: Calculate lot size based on risk tolerance.
- Stop-Loss: Define fixed or dynamic stop levels (e.g., 30 pips).
- Take-Profit: Set profit targets aligned with risk-reward ratio (e.g., 1:1.5).
- Max Drawdown: Limit losses (e.g., 7% of account equity).
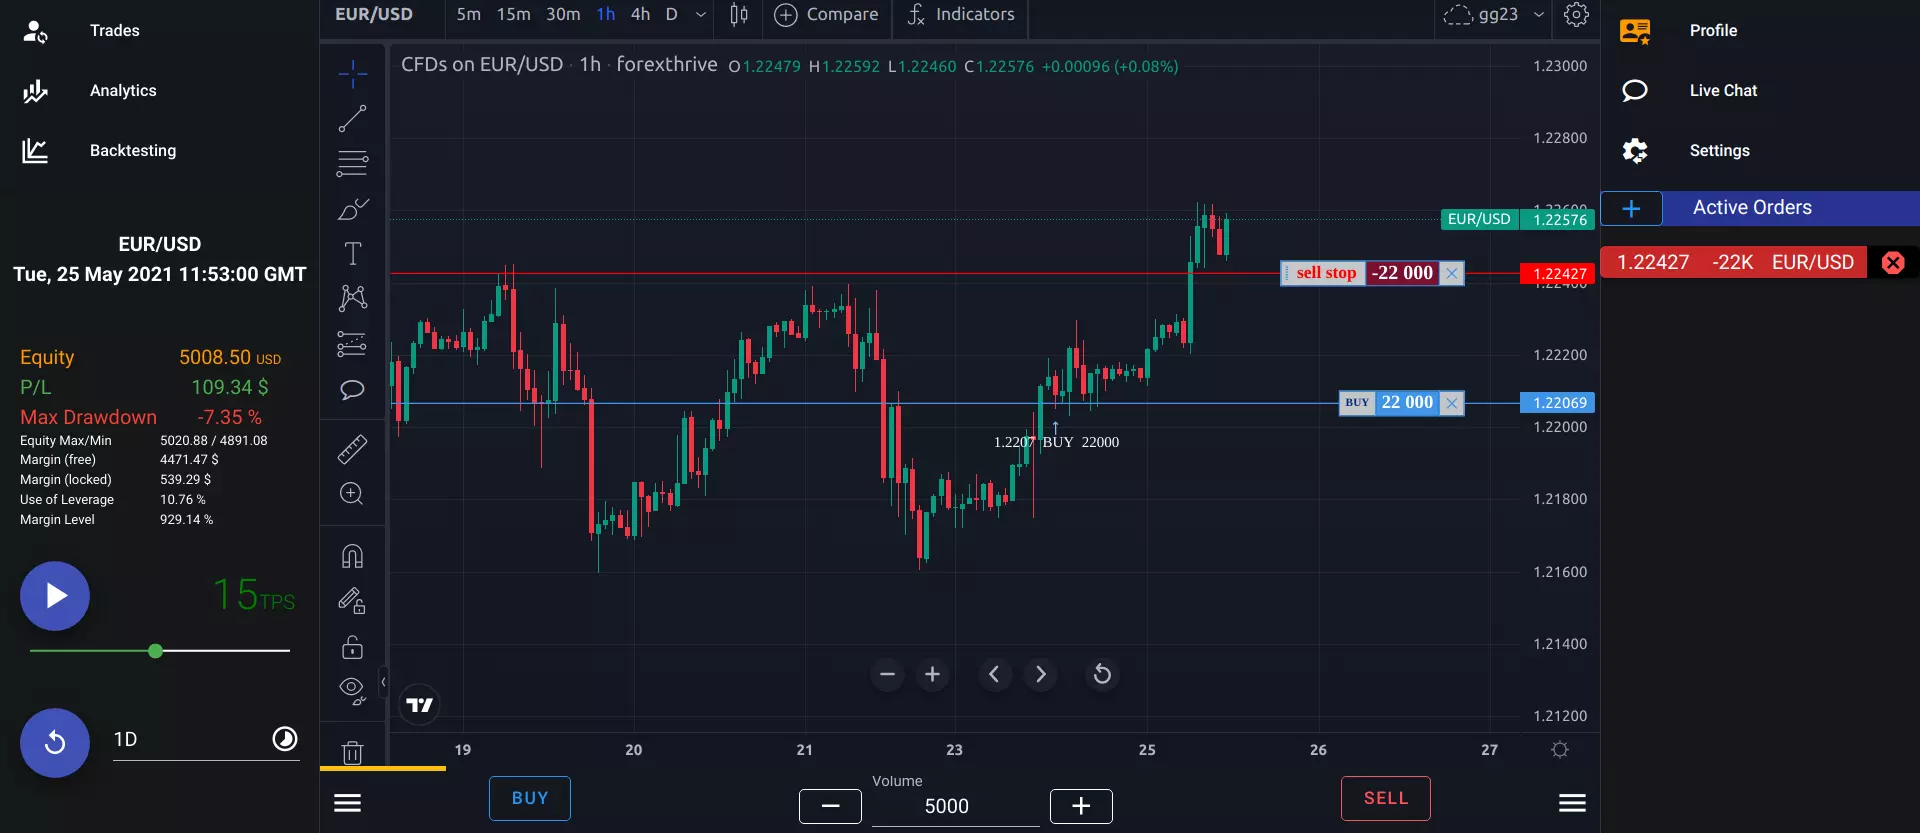
5. Order Placement Using OTA Orders
- Entry Setup: Configure One-Triggers-the-Other (OTO) orders (e.g., Buy Stop/Sell Stop).
- Exit Automation: Link stop-loss and take-profit orders to entries.
6. Backtesting & Optimization
- Historical Data: Test strategy on past market data (e.g., 2-year period).
- Metrics: Validate win rate, drawdown, and consistency.
- Adjustments: Refine parameters (e.g., indicator periods, risk levels).
7. Execution & Monitoring
- Live Trading: Deploy strategy with strict adherence to rules.
- Journaling: Track all trades, including rationale and outcomes.
- Adjustments: Modify strategy based on performance or market shifts.
Most retai traders are inherently impassioned—prone to over-trading, addicted to the dopamine rush of wins, and paralyzed by chart obsession. Instead of fighting these “flaws,” we embrace them. Let’s design a strategy that harnesses these impulses, transforming urgency into precision and hunger into disciplined execution.
Step-by-Step Example: Trading Strategy for EUR/USD
1. Define Strategy Objectives & Parameters
- Trading Pair: EUR/USD
- Order Type: OTA (One Triggers the Other) orders for entries (e.g., Buy Stop/Sell Stop).
- Monthly Profit Target: 3% (compounded).
- Max Drawdown (DD): 7% of account equity.
- Minimum Trades/Month: 10.
- Risk Per Trade: 0.7% per trade (10 trades * 0.7% risk = 7% max DD).
- Risk-Reward Ratio: 1:1.5 (e.g., 30-pip stop-loss, 45-pip take-profit).
2. Technical Analysis Rules
A. Trend Identification (Daily Chart)
- Use 50-period EMA and 200-period EMA to determine trend direction:
- Bullish Trend: Price above both EMAs.
- Bearish Trend: Price below both EMAs.
- Only trade in the direction of the trend.
B. Entry Signal (4-Hour Chart)
- Bollinger Bands (20,2): Identify volatility contractions (bands narrowing).
- RSI (14): Confirm entry when RSI crosses above 30 (bullish) or below 70 (bearish).
- Entry Setup:
- Place Buy Stop 5 pips above the upper Bollinger Band in a bullish trend.
- Place Sell Stop 5 pips below the lower Bollinger Band in a bearish trend.
- Cancel the opposing OTA order once one is triggered.
C. Exit Rules
- Take-Profit: Fixed 45 pips (1:1.5 risk-reward).
- Stop-Loss: 30 pips from entry.
- Trailing Stop: Activate a 15-pip trailing stop after price moves 20 pips in profit.
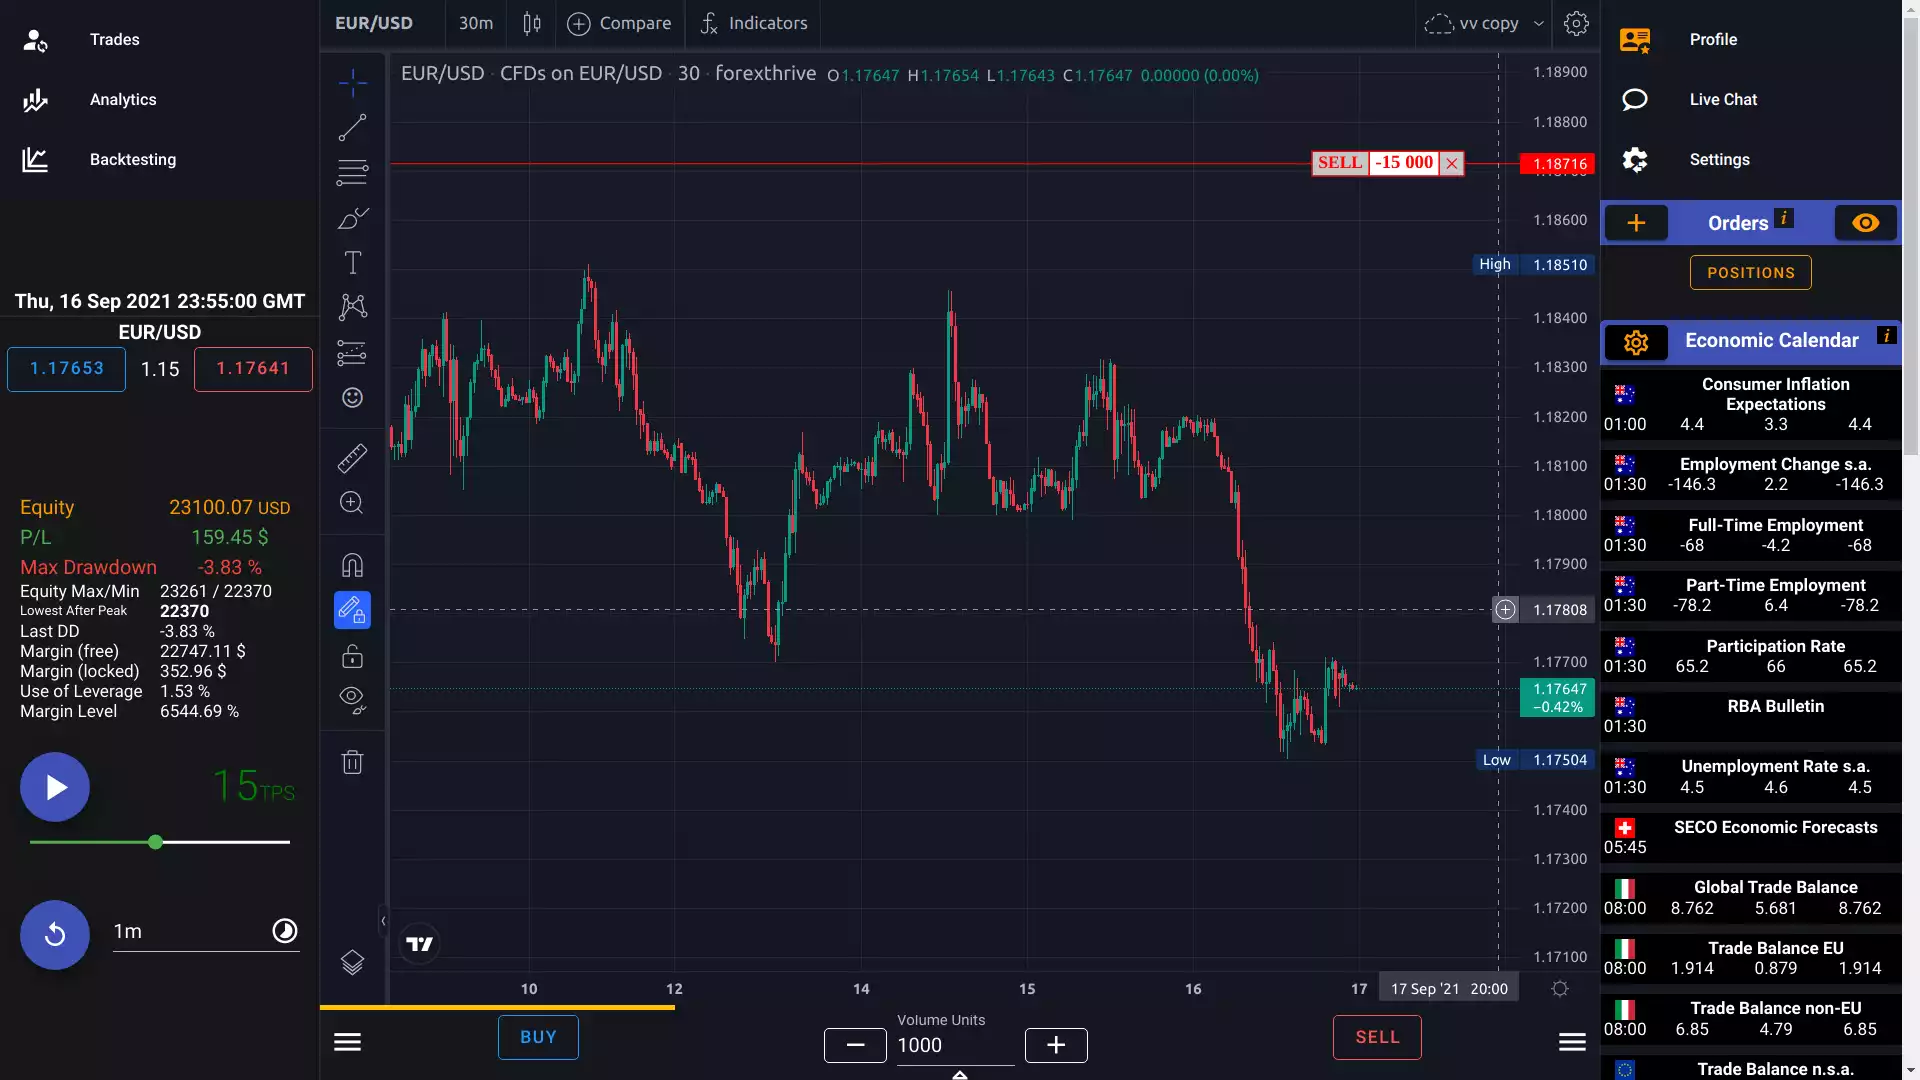
3. Fundamental Analysis Integration
- Avoid High-Impact News: Do not open new positions 30 minutes before/after these events:
- Eurozone: ECB Rate Decisions, CPI, GDP, Unemployment Rate.
- U.S.: FOMC Meetings, NFP, CPI, Retail Sales.
- Adjust Stop-Losses: Widen stops by 10 pips during news releases if already in a trade.
4. Risk Management
- Position Size:
Calculate lot size using:
Lot Size = (Account Equity * 0.007) / (Stop-Loss in pips * Pip Value)
Example: $10,000 account, 30-pip SL → Lot Size = (10,000∗0.007)/(30∗10,000∗0.007)/(30∗10) = 0.23 lots.
- Daily Loss Limit: Stop trading after 2 consecutive losses.
5. OTA Order Execution
- Set Entry Orders:
- In a bullish trend, place a Buy Stop 5 pips above the upper Bollinger Band and a Sell Stop 5 pips below the lower band.
- In a bearish trend, reverse the above.
- Cancel Opposing Order: Automatically cancel the untriggered OTA order after one is executed.
6. Backtesting & Optimization
- Test Period: Use 2 years of historical data (e.g., 2021–2023).
- Metrics to Validate:
- Win Rate ≥ 40% (to achieve 3% monthly profit with 1:1.5 RR).
- Max DD ≤ 7%.
- Average trades/month ≥ 10.
- Adjustments: Fine-tune Bollinger Band/EMA periods or RSI thresholds if needed.
7. Live Execution & Monitoring
- Trade Journal: Log all trades, including entry/exit rationale and news events.
- Monthly Review:
- If profit < 3%, reduce lot size by 10%.
- If DD approaches 5%, halve position sizes.
Example Trade
Scenario: EUR/USD in bullish trend (price above 50/200 EMA).
- Entry: Buy Stop at 1.0950 (5 pips above upper Bollinger Band).
- Stop-Loss: 1.0920 (30 pips).
- Take-Profit: 1.0995 (45 pips).
- Result: 45-pip gain = 1.05% return on risk (0.7% * 1.5).
By combining trend-following technicals, disciplined risk management, and OTA orders, this strategy aims to capitalize on EUR/USD volatility while limiting drawdowns. Adjust parameters in response to changing market conditions.