Forex Trading Simulator

Online Backtesting

Backtesting has been used by big companies and professional traders to improve many aspects of their trading strategies.

No installs, it's web-based

Better and faster way to your trading strategy validation


Try it Free

forex simulator knowledge circle

More that 95% of retail forex traders fail to become profitable, mainly because they do not have a strategy or do not execute it properly.


Time-efficient Demo Trading

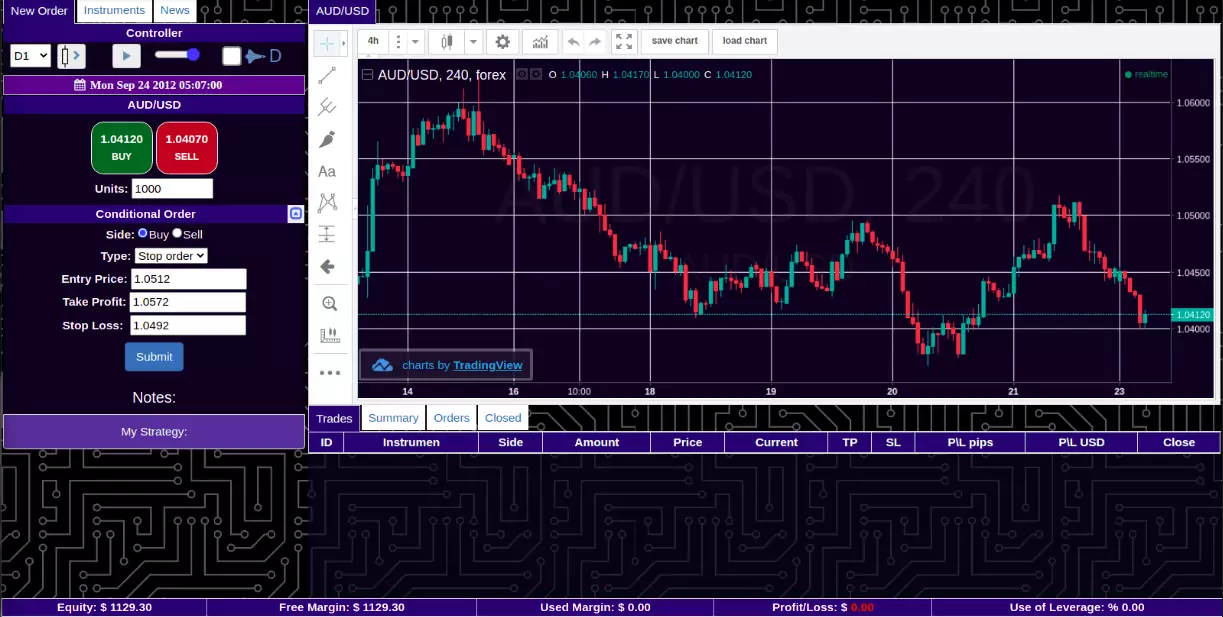
Replay forex markets in the browser.

No more risky software installs, no need to download historical fx-data.

Autoplay or bar by bar steps

forex simulator replay

Quick units based market order, 1 unit min trade size

forex simulator market-order

Simple fast and convenient backtesting, all major US pairs ready.

online-forex-simulator

Test trading strategies online

Fast switching between sessions

Run many simultaneous sessions on multiple browser tabs

Forexthrive simulator by forethrive

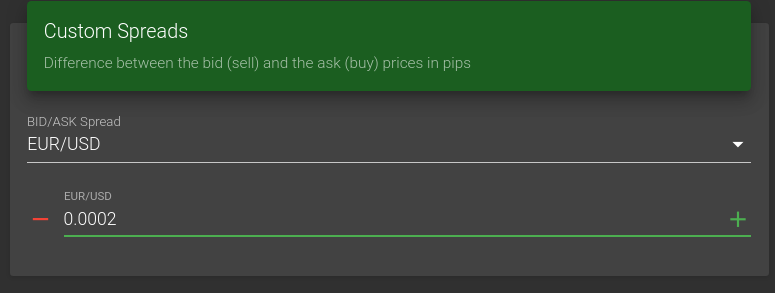
Set custom trading instrument BID/ASK Spreads

Dynamic values based on market volatility

Forexthrive simulator by forethrive

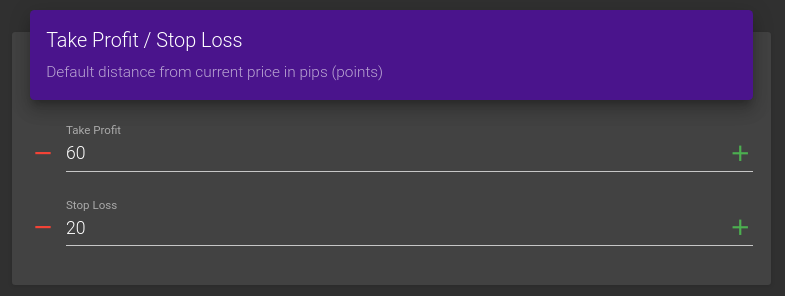
Preset stop orders distance

Take-profit and stop loss applied by single click

Forexthrive simulator by forethrive

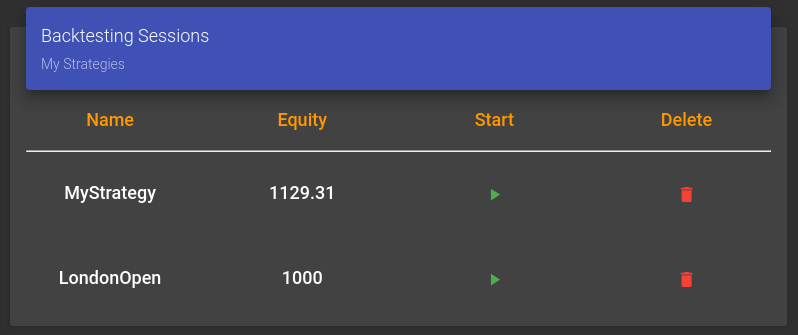
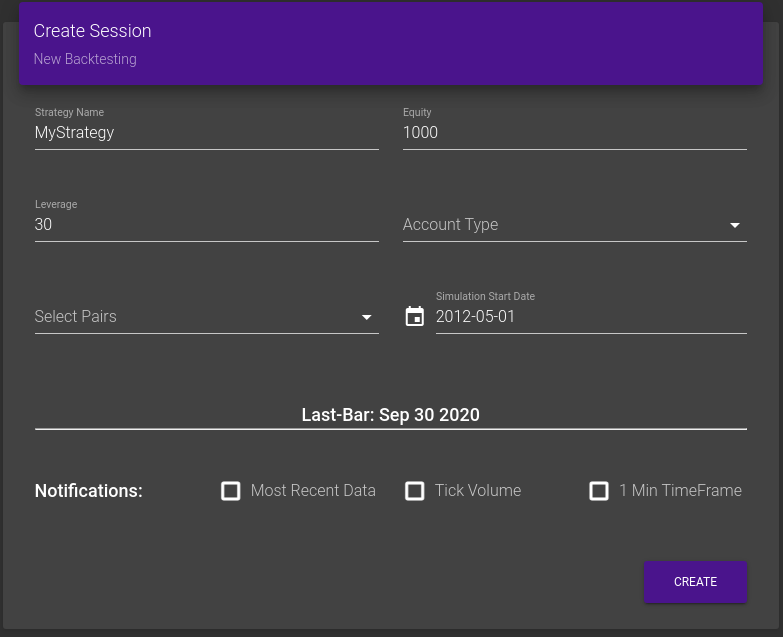
Create and store many named sessions

Trading different margin equity, leverage, account types and timespans

Forexthrive simulator by forethrive

Standart account

You can have only one position, at the same time for the same symbol.

Opposite positions will selloff each other according to the trading volume.

Hedging account

Margin will be calculated based upon the largest side of a hedged position

You can have multiple positions, at the same time for the same symbol.

Forexthrive simulator by forethrive

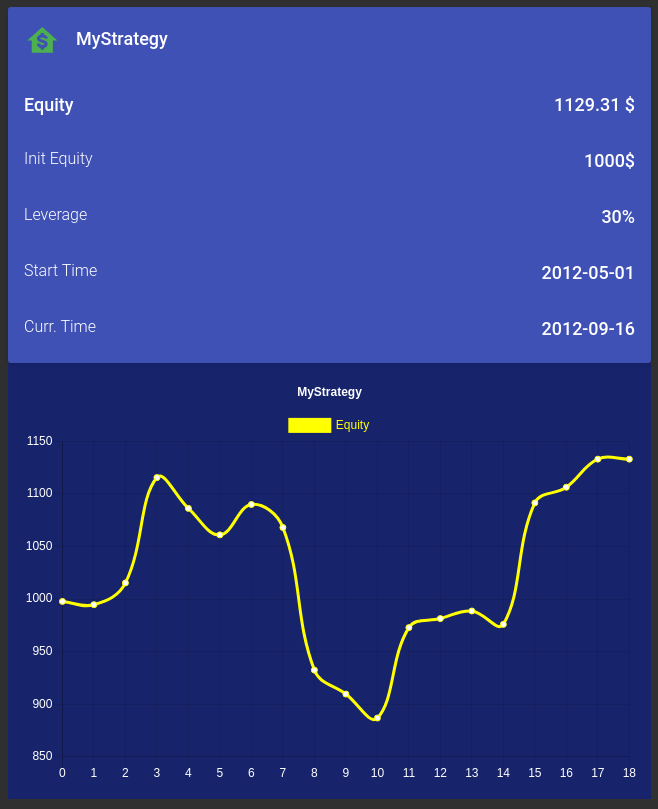
Compare trading performance

Trading Analytics

Drawdown Risk Active Monitoring

Good trading strategy is the one that best suits your personality.

The best trading strategy is the one that most suits market conditions.

Forexthrive start new session

Finding and identifying the best markets for your trading style is very slow process.

Simulators and backtesting make trading strategy validation faster,
easier and more understandable.

Forexthrive start new session

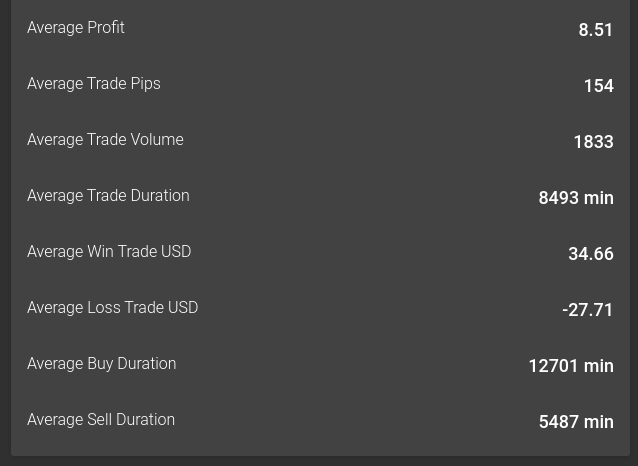
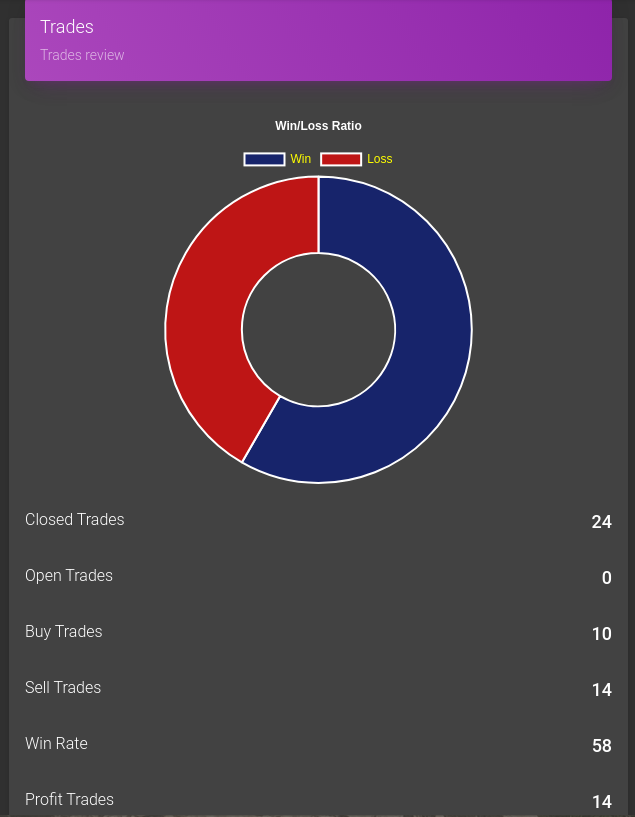
Session statistics

Closed Trades
Open Trades
Buy Trades
Sell Trades
Win Rate
Profit Trades
Loss Trades
Consecutive Wins (max)
Consecutive Losses (max)
Best Trade USD
Worst Trade USD
Total Traded Volume (units)
Average Profit
Average Trade Pips
Average Trade Volume
Average Trade Duration
Average Win Trade USD
Average Loss Trade USD
Average Buy Duration
Average Sell Duration

Trading session statistics introduce comparable clearly distinctable data-driven validation mechanism.

Superior trading tool

Charts by TradingView

Offer Advanced Technical Analysis

Supported time frames for simulated trading

Minutes time frames: 1m, 5m, 10m, 15m, 30m, 45m

Hour time frames: 1h, 2h, 3h, 4h

Daily time frames: 1D

Bars, Candles, Area, Hollow Candles, Line, Heikin Ashi

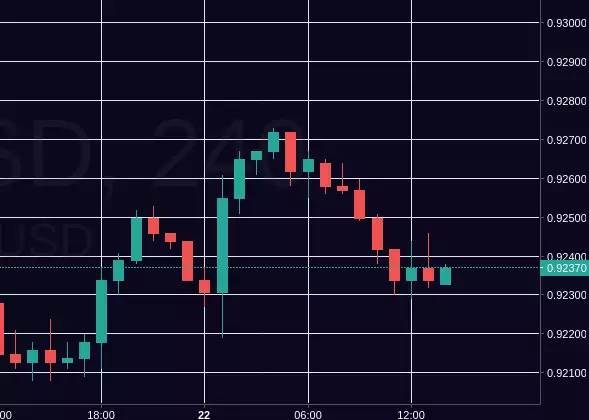
Japanese candlestick chart

Popular candlestick chart identify trading instrument opening and closing prices, highs and lows, and overall range for selected time frame

forex simulator candles-chart

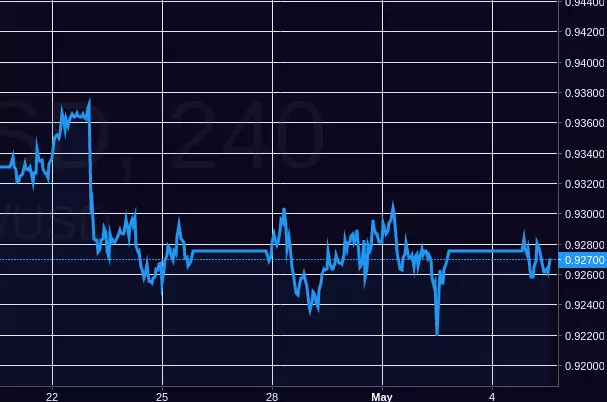
Area Chart

Based on the line chart. The area between axis and line are commonly emphasized with colors, textures and hatchings.

forex simulator area-chart

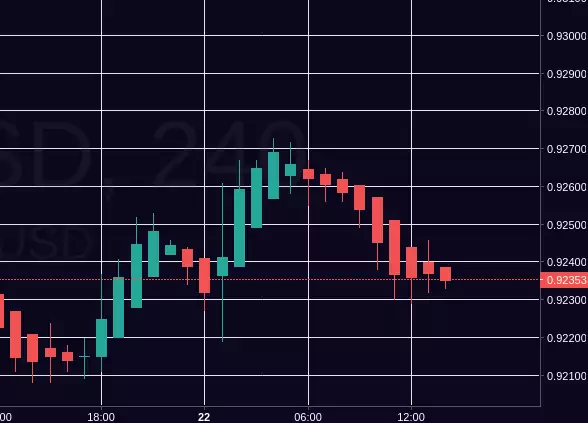
Heikin-Ashi Chart

Heikin-Ashi is a candlestick pattern technique that aims to reduce some of the market noise, creating a chart that highlights trend direction better than typical candlestick charts. The downside to Heikin-Ashi is that some price data is lost with averaging, which could affect risk.

forex simulator candles-chart

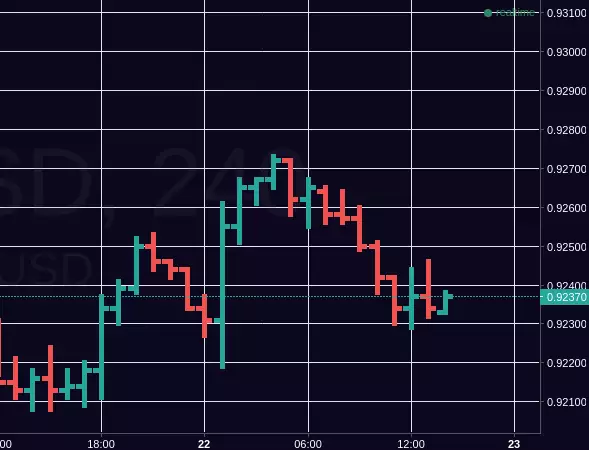
OHLC Bars Chart

Similar to candlestick chart an OHLC bars chart is a type of bar chart that shows open, high, low, and closing prices for each period. OHLC charts are useful since they show the four major data points over a period, with the closing price being considered the most important.

forex simulator bars-chart

Including many Technical Indicators

Accumulation/Distribution, Advance/Decline, Arnaud Legoux Moving Average, Aroon, Average True Range, Awesome Oscillator, Balance of Power, Bollinger Bands, Bollinger Bands %B, Bollinger Bands Width, Chaikin Money Flow, Chaikin Oscillator, Chande Kroll Stop, Chande Momentum Oscillator, Choppiness Index, Commodity Channel Index, Coppock Curve, Correlation Coeff, Directional Movement Index, Donchian Channels, Double Exponential Moving Average, Ease of Movement, Elders Force Index, Envelope, Hull MA, Ichimoku Cloud, Keltner Channels, Klinger Oscillator, Know Sure Thing, Least Squares Moving Average, Linear Regression Curve, MA Cross, Mass Index, Momentum, Money Flow, Moving Average, Moving Average Convergence/Divergence, Moving Average Exponential, Moving Average Weighted, Parabolic SAR, Price Oscillator, Relative Strength Index, Relative Vigor Index, Relative Volatility Index, SMI Ergodic Indicator/Oscillator, Stochastic, Stochastic RSI, TRIX, Triple EMA, True Strength Indicator, VWMA, Willams %R, Williams Alligator, Williams Fractals, Compare, Overlay, ZigZag

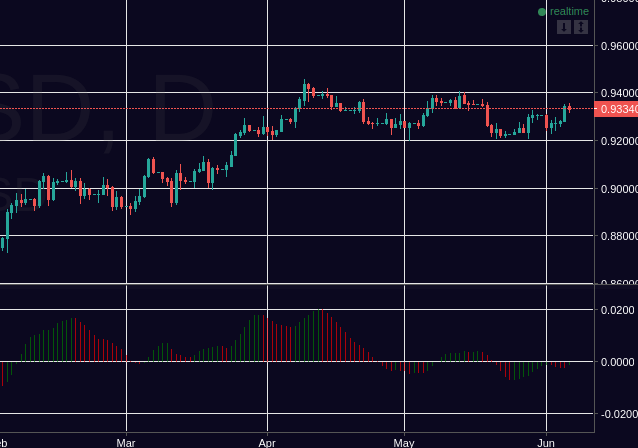
Awesome Oscillator

forex simulator oscillator-indicator

The Awesome Oscillator (AO) is an indicator used to measure market momentum. AO calculates the difference between a 34 Period and 5 Period Simple Moving Average. The Simple Moving Averages that are used are not calculated using closing price but rather each bar's midpoints.

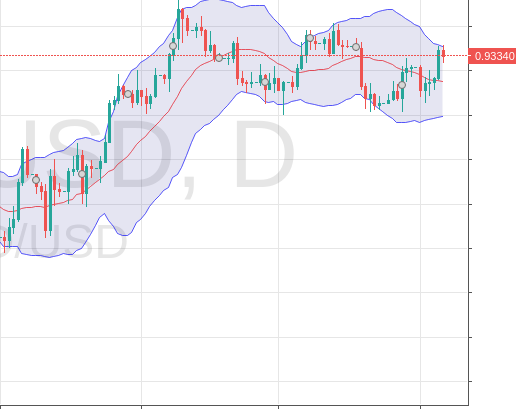
Bollinger Bands

forex simulator Bollinger Bands indicator

Bollinger Bands are envelopes plotted at a standard deviation level above and below a simple moving average of the price. Bollinger bands help determine whether prices are high or low on a relative basis. They are used in pairs, both upper and lower bands and in conjunction with a moving average.

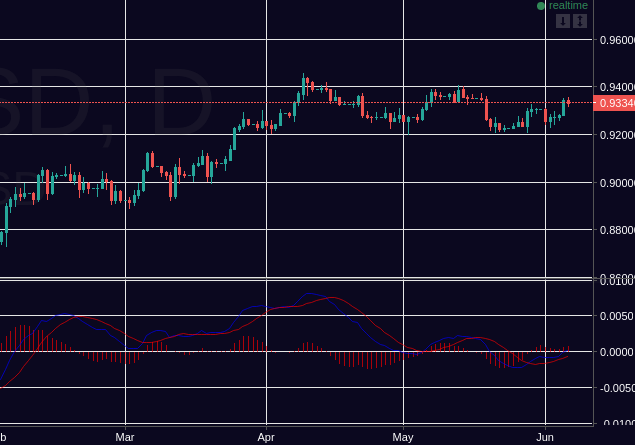
MACD indicator and Candles chart 1D time frame

forex simulator MACD indicator

Moving average convergence divergence (MACD) is a trend-following momentum indicator that shows the relationship between two moving averages of a security's price. The MACD is calculated by subtracting the 26-period exponential moving average (EMA) from the 12-period EMA.

Past performance is not indicative of future results