Current volatility means how quickly and how far price is moving right now. For traders, volatility decides whether your stop-loss is realistic, whether your take-profit is reachable, and how large your position should be.
Why volatility matters
- In high volatility, tight stops are easier to hit
- In low volatility, distant targets may never be reached
- Risk-reward settings must adapt to market conditions
- Strategy results become more realistic when volatility is considered
How to use volatility in your trade planning
- Measure current volatility before entry
- Scale TP/SL based on recent price movement (not fixed values only)
- Keep position size aligned with risk per trade
- Re-check volatility after major market events
Best indicators for volatility analysis
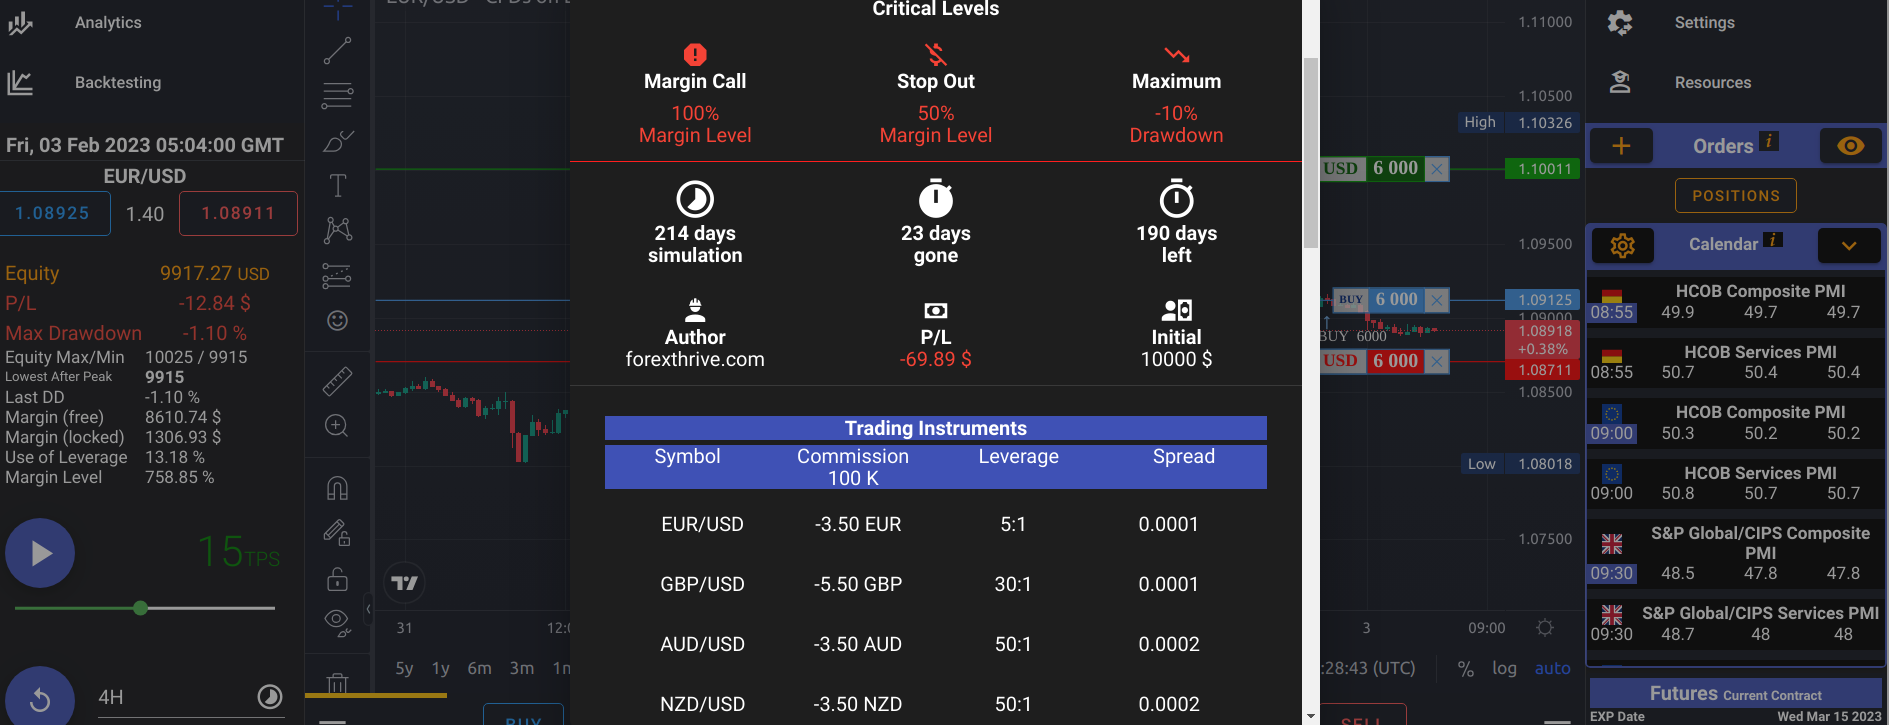
Use these on your TradingView-based chart in ForexThrive:
- ATR (Average True Range): measures average movement size
- Bollinger Bands: shows expansion/contraction phases
- RSI (momentum filter, not a volatility measure): a momentum oscillator that helps confirm direction and strength alongside the two volatility tools above
For a practical walkthrough, read: Volatility Indicators Explained
Practical rule for TP/SL
If ATR rises, markets are moving more per candle. You can widen SL and adjust TP to maintain your risk-reward logic, but reduce position size so the amount of money at risk stays the same. If ATR drops, tighten expectations and avoid oversized targets.
How to measure current volatility
- ATR (Average True Range): the average of the true range over recent candles, 14 by default. True range is the largest of the candle's high minus low and the distances from the previous close to the high or the low, so it also captures gaps. ATR is expressed in price units: an ATR of 0.0012 on EUR/USD means roughly 12 pips per candle on that timeframe.
- Standard deviation: how widely closing prices are spread around their average. It is the building block of Bollinger Bands.
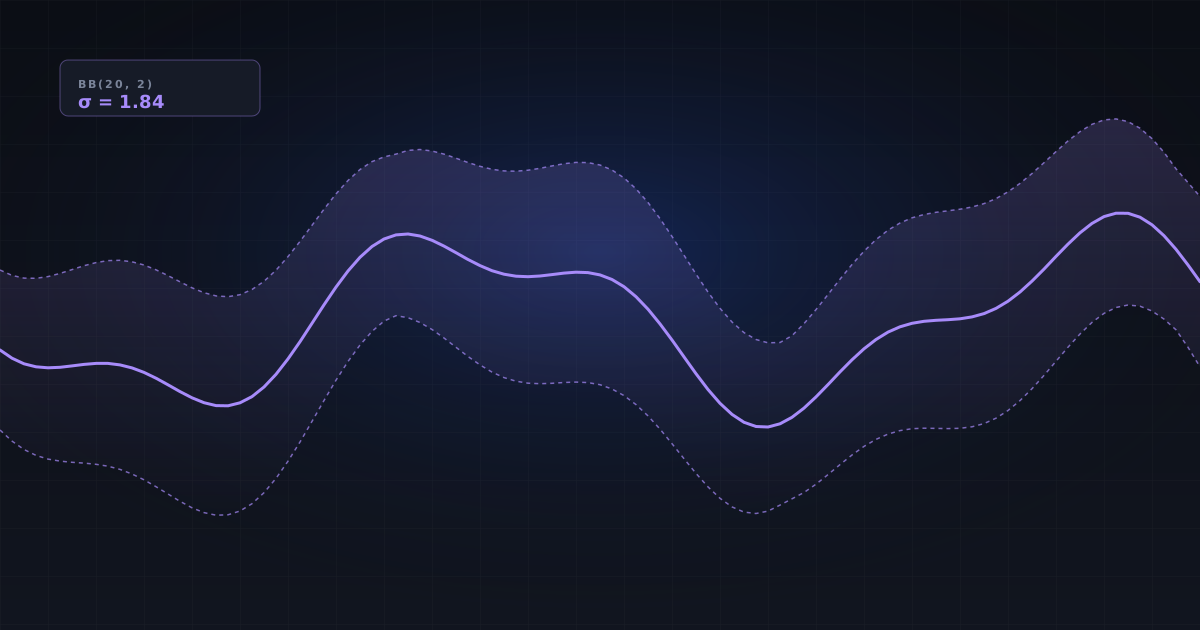
- Bollinger Band width: Bollinger Bands are a 20-period simple moving average with bands 2 standard deviations above and below it. The distance between the bands, often divided by the middle band, shows whether volatility is contracting (a squeeze) or expanding.
Compare each reading with its own recent history rather than with a fixed number. An ATR that has doubled since last week tells you more than the absolute value does.
Adapting stops and position size
When volatility rises, a fixed stop in pips gets hit by normal noise. The answer is to widen the stop and reduce the position size, so the amount of money at risk stays the same. When volatility falls, a tighter stop and a larger size can carry the same risk, but profit targets should shrink too.
Worked example: an ATR-based stop
- Account: $10,000, risking 1% per trade = $100.
- EUR/USD 1-hour ATR(14) = 0.0012, or 12 pips.
- Stop distance = 1.5 × ATR = 1.5 × 12 = 18 pips.
- For a USD account, one standard lot of EUR/USD is worth about $10 per pip, so the risk per lot is 18 × $10 = $180.
- Position size = $100 ÷ $180 ≈ 0.55 lots (rounded down), risking about $99.
- With a 2:1 reward-to-risk target, take profit sits 36 pips from entry.
If ATR doubles to 24 pips, the stop becomes 36 pips, the risk per lot becomes $360 and the size drops to about 0.27 lots. The dollar risk stays close to $100 even though the market is moving twice as far.
The 1.5 multiplier is a common starting point, not a rule. Replaying the same setup through calm and volatile periods in the simulator is a quick way to see how different multipliers affect your results.
Frequently asked questions
How do you measure current volatility?
The most common tools are ATR, which averages the true range of recent candles, standard deviation of closing prices, and Bollinger Band width. Compare each reading with its own recent history, for example today's ATR against its average over recent weeks, rather than with a fixed number.
How should I adjust my stop-loss when volatility rises?
Place the stop further from entry, for example a multiple of ATR, so normal noise does not trigger it, and reduce the position size so the dollar amount at risk stays the same. Adjust the take-profit distance as well to keep your intended reward-to-risk ratio.
Is RSI a volatility indicator?
No. RSI is a momentum oscillator that compares recent gains with recent losses on a 0 to 100 scale. It shows the direction and strength of moves, not their size, so use it alongside ATR or Bollinger Bands as a context filter rather than as a volatility measure.
What ATR multiple should I use for a stop-loss?
Multiples between about 1 and 3 times ATR are common, with 1.5 to 2 a typical starting point. The right value depends on your timeframe and strategy, so test a few multiples on historical data and compare win rate, average loss and drawdown before choosing one.