Manual backtesting is slower than running code, but it teaches you how a strategy actually feels to trade. This guide covers the method: how to set up a fair test, what to record, how to calculate the numbers, and how to avoid fooling yourself. If you still need to design the strategy itself, start with our trading strategy development guide.
The process in nine steps
- Write down exact rules before you look at any chart.
- Choose your markets, timeframe and a date range with different market regimes.
- Set realistic costs and a fixed position sizing method.
- Replay the chart bar by bar, hiding the future.
- Log every trade in a journal.
- Collect a large enough sample of trades.
- Calculate the key metrics.
- Interpret the results and check for biases.
- Forward test on data you have never seen.
Step 1: Write down exact rules first
A backtest is only as good as the rules behind it. If a rule needs judgement, you will make that judgement differently on different days, and the test stops measuring the strategy. Before you open a chart, write down:
- Entry: the exact condition that triggers a trade, for example "close above the 20-period high while price is above the 200 EMA".
- Stop loss: where it goes and why, such as "below the most recent swing low" or "1.5 × ATR from entry".
- Exit or target: a fixed target (for example 2R), a trailing stop, or a time-based exit.
- Position size: how much you risk per trade, usually a fixed percentage of the account.
- Filters: sessions you trade, news you avoid, maximum trades per day, pairs you skip.
A good test: could another trader read your rules and take the same trades as you? If not, tighten them.
Step 2: Choose markets, timeframe and date range
Pick the pairs you actually intend to trade and the timeframe your rules use. Then choose a date range long enough to include different market regimes:
- A clear trending period.
- A sideways, range-bound period.
- A high-volatility period with major news, such as central bank decisions or surprise inflation data.
A strategy that only makes money in one type of market is not necessarily bad, but you need to know that before you trade it. Decide the date range in advance and do not move it later because the results look better somewhere else.
Step 3: Set realistic costs and position sizing
Costs are where many good-looking backtests fall apart. Include:
- Spread: use the typical spread your broker charges, and remember it widens around news and at the daily rollover.
- Commission: if your account charges per lot, include it on every trade.
- Swap: overnight financing matters for trades held for days or weeks.
For sizing, risk a fixed percentage of the account on each trade, such as 1%. This keeps results comparable from trade to trade and lets you measure everything in R, where 1R is the amount you risked. Our position size calculator converts your stop distance and risk percentage into a lot size.
Step 4: Replay bar by bar and hide the future
The biggest danger in manual backtesting is seeing what happens next. If you scroll back through a finished chart, your eye finds the winning setups and skips the ugly ones. Instead:
- Start at the beginning of your date range with the right side of the chart hidden.
- Move forward one bar at a time and decide at each bar close whether your rules trigger.
- Place the trade with its stop and target, then keep moving forward until it closes.
- Do not change the rules mid-test. If you get an idea for an improvement, write it down and test it later as a separate version.
Step 5: Log every trade
Record every trade the rules produce, including the ones you would have liked to skip. A simple spreadsheet is enough. These are the columns worth keeping:
| Column | What to record |
|---|---|
| Date | Date and time of entry |
| Pair | For example EUR/USD |
| Direction | Long or short |
| Entry | Entry price |
| Stop | Initial stop loss price |
| Target | Planned take-profit price |
| Exit | Actual exit price, after costs |
| R multiple | Result divided by initial risk, for example +2.0R or -1.0R |
| Notes | Market condition, news, mistakes, screenshots |
The notes column is more useful than it looks. Tagging each trade as "trend", "range" or "news" lets you see later where the strategy works and where it struggles.
Step 6: Get a large enough sample
Ten trades tell you almost nothing. A strategy with a real edge can easily lose six in a row, and a random one can easily win six in a row. As a rule of thumb:
- 30 trades is a minimum before you draw any conclusion.
- 100 or more is much better.
- The trades should come from several market regimes, not one lucky month.
If your strategy trades rarely, extend the date range or test more pairs rather than loosening the rules to get more trades.
Step 7: Calculate the metrics
Once the sample is complete, calculate these numbers:
- Win rate: winning trades divided by total trades.
- Average win and average loss (in R): the typical size of each.
- Expectancy: (win% × average win R) − (loss% × average loss R). This is what you expect to make per trade, in R, over time.
- Profit factor: total R won divided by total R lost. Above 1.0 means the strategy made money.
- Maximum drawdown: the largest fall from an equity peak to a later low. See understanding max drawdown for how to read it.
- Longest losing streak: the most losses in a row. Ask yourself honestly whether you could keep following the rules through it.
Worked example
Suppose your test produced 40 trades: 16 winners averaging +2.5R and 24 losers averaging −1R.
- Win rate = 16 ÷ 40 = 40%, so the loss rate is 60%.
- Expectancy = (0.40 × 2.5) − (0.60 × 1) = 1.00 − 0.60 = +0.40R per trade.
- Total won = 16 × 2.5 = 40R. Total lost = 24 × 1 = 24R.
- Profit factor = 40 ÷ 24 = 1.67.
- Net result = 40R − 24R = +16R, which also equals 40 trades × 0.40R.
At 1% risk per trade, +16R is roughly +16% before compounding. Notice that the strategy loses more often than it wins and is still profitable, because the winners are much larger than the losers. Win rate alone never tells the full story.
Step 8: Interpret the results and avoid biases
Positive expectancy is a good start, not proof. Check your test against these common traps:
- Overfitting (curve-fitting): if you keep adjusting settings until the backtest looks perfect, you are fitting the past, not finding an edge. Simple rules with few parameters usually hold up better.
- Look-ahead bias: using information that was not available at the time, such as a bar's close before it closed, or an indicator value that repaints.
- Survivorship bias: only studying what survived, such as strategies or traders you have heard of. Read more in our article on survivorship bias.
- Cherry-picking dates: testing only the period where the strategy looks good. Fix the date range in advance.
Also split the results by regime using your notes. If almost all the profit came from one trending month, the strategy may need a filter that keeps you out of ranges, which you then test as a new version on new data.
Step 9: Forward test on unseen data
The final check is data the strategy has never seen. Forward testing means trading the same rules on new price action, either on a later period you deliberately kept aside or in real time on a demo or simulator. If expectancy, drawdown and losing streaks stay roughly in line with the backtest, you have much more reason to trust it. If the results collapse, the backtest was probably overfitted.
Backtesting in ForexThrive
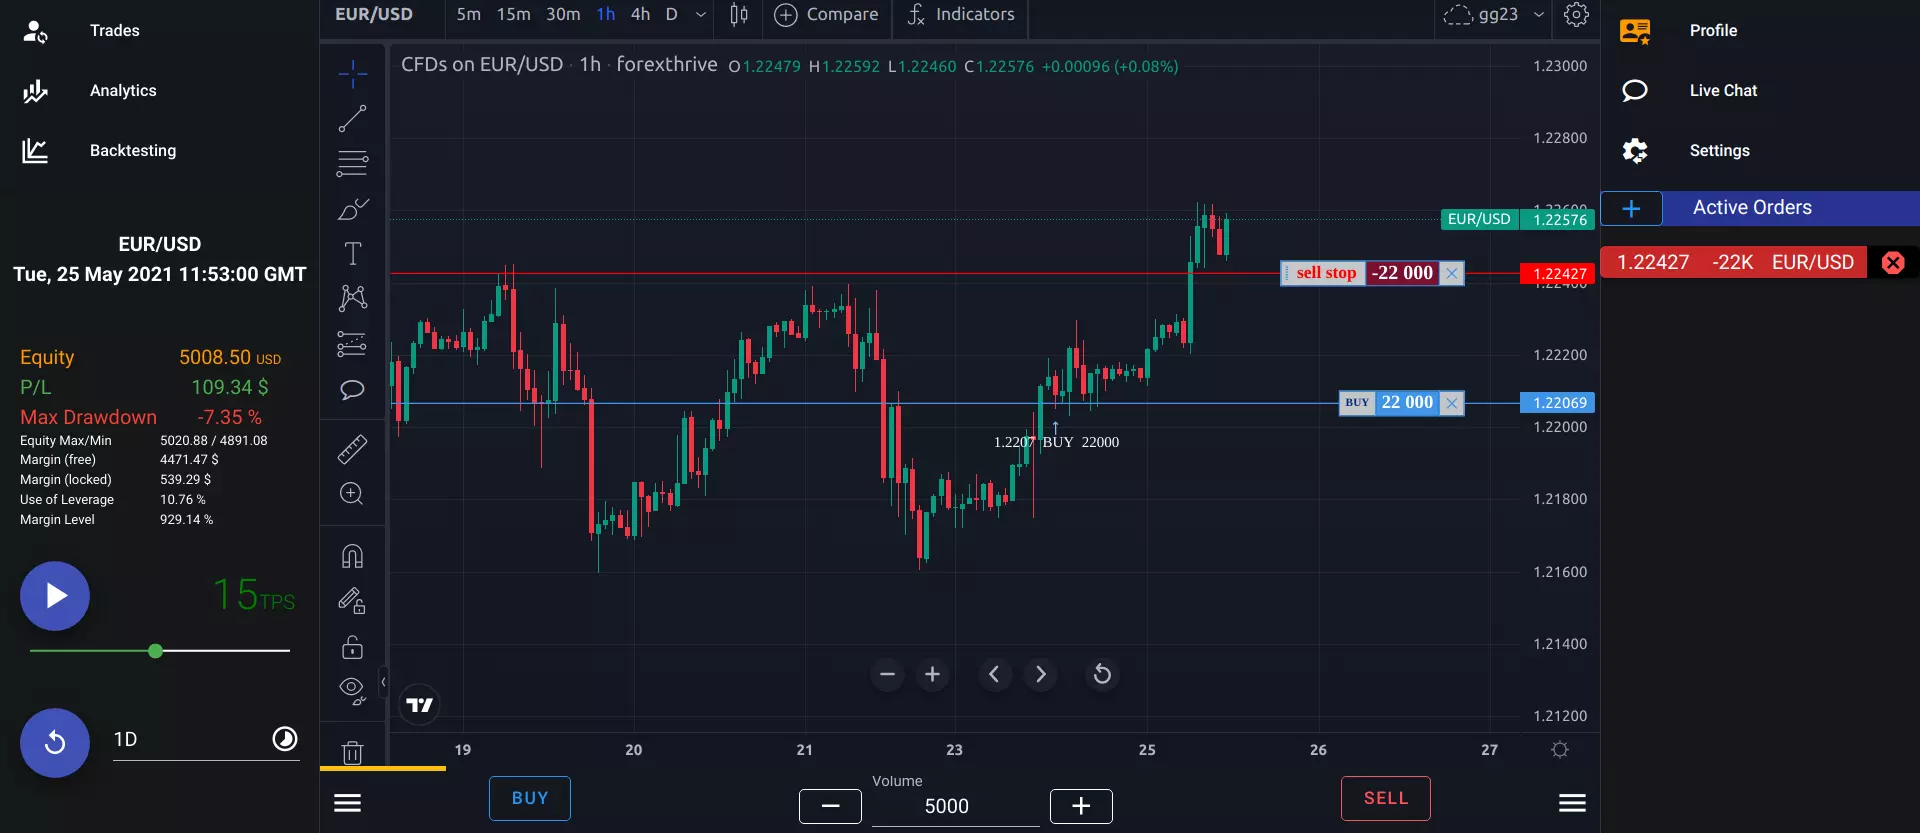
ForexThrive is a browser-based replay simulator that also works on phones, so you can follow this method without special software. It replays the market bar by bar from 1-minute data with speed control, which keeps the future hidden (step 4). You can place market, limit, stop-limit, bracket and OTA orders, and spread, commission and overnight swap are applied to your trades (step 3). Charts run on TradingView with 40+ indicators, and the built-in statistics and CSV export help with logging and metrics (steps 5 and 7).
The free plan gives you one predefined game from 22 February to 23 May 2022 with the full engine. A prepaid plan lets you create up to five games on any dates back to 2006, so you can pick different regimes. If a game's replay reaches today, it continues on 1-minute-delayed live data in the same session, which gives you a forward test (step 9). For a walkthrough of the app itself, see the backtesting starter guide.
Frequently asked questions
How many trades do I need for a reliable backtest?
Aim for at least 30 trades before drawing any conclusion, and 100 or more if possible. The trades should also come from different market conditions, such as trends, ranges and news-driven periods. A small sample from one lucky month can make a weak strategy look strong, or a good strategy look broken.
Is manual backtesting better than automated backtesting?
Neither is simply better. Automated testing is faster and handles large samples, but it needs coding skills and fully mechanical rules. Manual backtesting is slower, yet it trains your eye, shows you how drawdowns feel, and works for rules that are hard to code. Many traders start manually and automate later.
What is a good expectancy for a forex strategy?
Any expectancy above zero after costs means the strategy made money in the test. Many traders look for something around +0.2R per trade or higher, but the number only matters with a large enough sample and an acceptable maximum drawdown. A high expectancy from 15 trades is far less convincing than a modest one from 150.
How long does a manual backtest take?
It depends on your timeframe and how often the strategy trades. A daily-chart strategy may need several years of data to reach 100 trades, while an intraday strategy can reach that in a few months of data. Replaying at higher speed between setups saves time, but slow down near potential entries.
Can I change my rules after the backtest?
Yes, but treat the changed rules as a new strategy. Test the new version on a different date range, not the one you used to find the improvement. Otherwise you are simply fitting the rules to past data, and the results will look better than they are likely to be in live trading.